| Category | Key Facts & Figures |
|---|---|
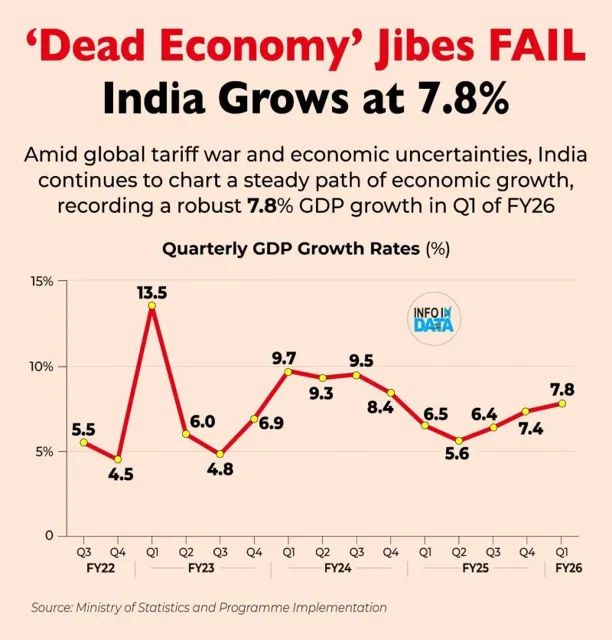
| Overall GDP Growth | 7% in Q2 FY26 (down from 7.8% in Q1), per ICRA Ratings. |
| GVA Growth | 7.1% in Q2 (down from 7.6% in Q1). |
| Services Sector | GVA fell to 7.4% (from 9.3% in Q1) due to lower govt spending & exports. |
| Services Exports | $101.6B (8.7% growth) vs $97.4B (10.1%) in Q1. |
| Agriculture Sector | GVA at 3.5% (vs 3.7% in Q1), impacted by floods & unseasonal rains. |
| Industrial Sector | GVA rose to 7.8% (5-quarter high) due to festive demand, GST cuts, US export rush. |
| Government Capex | Fell to 30.7% in Q2 (from 52% in Q1), absolute spending rose to ₹1.01L cr. |
| State Capex (22 states) | Declined 4.6% in Q2 (vs 23% jump in Q1) due to base effect. |
| Net Indirect Taxes | Contracted 5.2% in Q2 (vs 11.3% growth in Q1) due to lower subsidies. |
| GDP-GVA Gap | Shifted from +18 bps in Q1 to -10 bps in Q2. |
| H2 FY26 Outlook | Growth may dip below 7% if govt capex remains low & tariff uncertainties persist. |

Workflow
Login
Contact Counsellor